Mapping the Gaps: How Geographic Visualization Tools Are Transforming Institutional Data Research
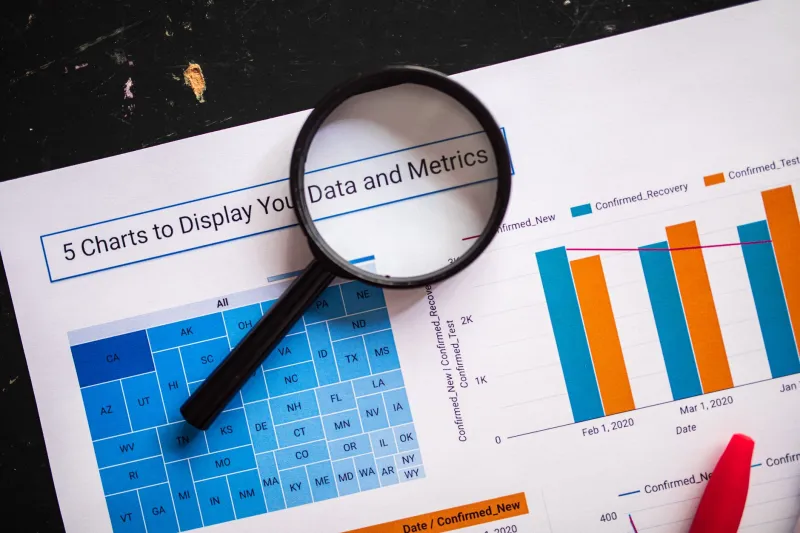
For decades, researchers working with location-specific institutional data — whether cataloging lodging establishments, tracking service-sector facilities, or analyzing the spatial distribution of registered businesses — relied on static tables and county-level aggregations that obscured as much as they revealed. The emergence of interactive geographic mapping platforms has fundamentally changed that workflow. Today, a data professional can render thousands of geo-coded records as a navigable visual layer, identify clustering patterns in minutes, and export subsets tied to precise boundary conditions.
But with that power comes a new class of methodological risk. Understanding what mapping tools actually do to your data — and what they silently assume — is no longer optional for serious research practice.
What Institutional Mapping Tools Actually Do
At their core, geographic mapping platforms designed for institutional datasets perform three operations: they accept structured records with location attributes (latitude/longitude coordinates, street addresses, or postal codes), they resolve those attributes to a spatial reference system, and they render the result as a visual layer on a base map. Tools built specifically for cataloging facilities — hotels, inns, licensed establishments, registered service providers — add a fourth function: attribute filtering, which allows users to query the visual layer by business type, regulatory status, capacity, or other structured fields.
The appeal is obvious. A researcher studying the distribution of lodging capacity across rural US counties, for instance, can move from a raw CSV to an annotated map in a matter of hours. Patterns that would require complex spatial joins in a GIS environment become immediately legible. Gaps in coverage — counties with no registered facilities of a given type — become visually self-evident rather than requiring the analyst to construct an absence query.
What is less obvious is that each of these operations introduces assumptions that may or may not be documented in the platform's methodology.
The Geocoding Problem
The first and most consequential assumption is geocoding quality. When a mapping tool converts a street address to a coordinate pair, it relies on a reference database — typically a commercial geocoding service or a public-sector address database maintained by state or local governments. The accuracy of that conversion varies substantially by geography.
Urban addresses in major metropolitan areas are geocoded with high precision. Rural addresses, particularly in states with non-standard road naming conventions or recent boundary changes, are geocoded with far lower reliability. A facility recorded at a rural route address may be placed several miles from its actual location — a discrepancy that becomes analytically significant when the research question involves proximity to infrastructure, population centers, or jurisdictional boundaries.
For researchers using institutional mapping tools to study facility distributions in rural or exurban contexts, this is not a minor technical footnote. It is a structural bias that can systematically misrepresent the spatial relationship between facilities and the populations or resources they are meant to serve.
Boundary Definitions and the Jurisdictional Seam
A second layer of complexity involves the boundary definitions used to aggregate or filter mapped records. Most institutional datasets are organized around administrative jurisdictions — counties, municipalities, census-designated places, or regulatory districts. Mapping tools typically allow users to filter by these jurisdictions, but the boundaries used by the mapping platform may not match the boundaries used by the source dataset.
This is not a hypothetical concern. County boundary revisions, municipal annexations, and changes to census-designated place definitions occur regularly and are not always propagated simultaneously across the data infrastructure that feeds mapping tools. A researcher querying a mapping platform for all registered facilities in a specific county may receive a result set that reflects an earlier boundary definition — one that either includes facilities now administratively located in an adjacent jurisdiction or excludes facilities that have since been annexed.
The practical implication is that any count or density calculation derived from a mapped institutional dataset should be validated against the source dataset's own jurisdictional coding, not assumed to be accurate by virtue of appearing on a correctly rendered map.
Attribute Completeness and the Silence of Missing Fields
Mapping tools render what they are given. If the underlying institutional dataset has incomplete attribute coverage — facilities with missing capacity figures, unlicensed status flags, or absent contact records — the map will display those facilities as if they were fully characterized. The visual representation conveys no information about data completeness unless the platform has been specifically designed to surface it.
This matters because researchers frequently use mapped institutional data to make inferences about total capacity, market coverage, or service availability. A map showing 847 lodging facilities distributed across a three-state region appears comprehensive. Whether those 847 records represent 60 percent or 95 percent of the actual facility population is invisible in the visual layer — and often undocumented in the platform's metadata.
Before drawing any analytical conclusions from a mapped institutional dataset, data professionals should request or independently assess the dataset's coverage rate: what proportion of the known universe of facilities in a given category and geography does the dataset actually represent? This figure should be treated as a fundamental parameter of the analysis, not an afterthought.
Temporal Currency and the Stale Pin
Institutional datasets age. Facilities open, close, change ownership, and change regulatory status continuously. A mapping platform that was last refreshed eighteen months ago may display a facility that has since closed, or fail to display one that has since opened. In a stable, low-turnover sector, this may introduce only marginal error. In a high-turnover sector — short-term lodging, for instance, which has experienced substantial structural change over the past decade — a stale dataset can produce a map that is materially misleading.
Researchers should treat the data currency date as a mandatory disclosure in any publication or report derived from a mapped institutional dataset. The map's visual immediacy creates a powerful impression of present-tense accuracy. That impression needs to be explicitly qualified.
Using Mapping Tools Responsibly
None of these cautions are arguments against using geographic visualization tools. They are arguments for using them with the same methodological rigor applied to any other analytical instrument. Specifically:
- Document the geocoding methodology used by the platform and assess its reliability for the specific geographies under study.
- Validate jurisdictional boundaries against authoritative sources, particularly for research involving county or municipal-level aggregation.
- Assess and report attribute completeness before making coverage or capacity inferences from mapped records.
- Record and disclose the data currency date in any published output derived from the platform.
- Cross-reference mapped results against independent sources where feasible, particularly for high-stakes research applications.
Geographic visualization is one of the most powerful tools available to institutional data researchers. Like any powerful tool, it rewards careful handling. The map is not the territory — and in data research, the gap between the two is where the most consequential errors tend to live.
YWT Data provides resources, datasets, and analytical guidance for research and data professionals. For additional methodological frameworks related to spatial data analysis, see our Statistical Methods archive.